


Stock Chart Plugin
Stock Chart and Stock Tables is a standard plugin module for displaying daily stock movement of ASX Exchange, as well as summary of stocks that fall into the following categories: Top Active, Top Gainers and Top Losers. It is widely used in the i3investor portal, as it provides important and (almost) real time stocks movement information on a trading day.
If you are a Blogger or Website Publisher, and wish to incorporate this plugin module into your website, just copy the following code, then paste it onto every page you want to show the Stock Chart and Tables.
 <!-- begin i3investor stock chart -->
 <iframe src = "https://au.i3investor.com/jsp/module/mod_side_chart.jsp"
 width="240" height="450" scrolling="no" frameborder=0> </iframe>
 <!-- end i3investor stock chart -->
This will display a Stock Chart and Stock Tables like below in the body of your page.
Width: 240px; Height: 450px;
If you are publishing your blogs through Blogger.com, you can use the following 3 simple steps to add the Stock Chart plugin module to your blog.
Select "Add a Gadget" from the Blogger Layout page.
Select the "HTML/Javascript" gadget. 

Provide a Title and paste the code above into the Content of this Gadget. 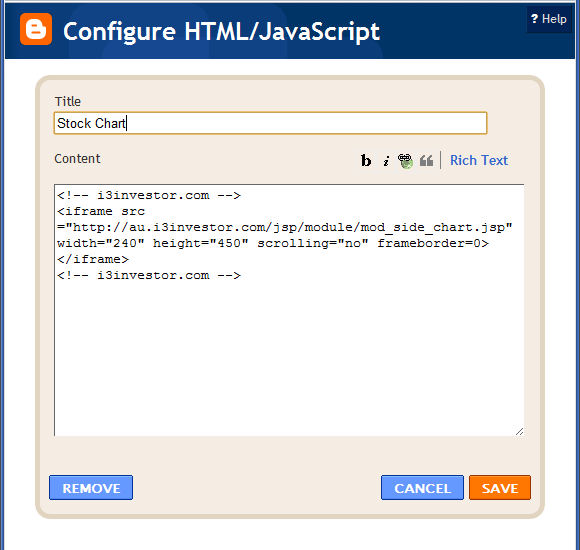


Apps


Top Articles
1
2
CEO Morning Brief
Australian Jobs Surprisingly Fall, Giving RBA Scope for Patience
3
#
Stock
Score
Daily Stocks
Stock
Last
Change
Volume

Ride The Bull Short The Bear
CS Tan
4.9 / 5.0
This book is the result of the author's many years of experience and observation throughout his 26 years in the stockbroking industry. It was written for general public to learn to invest based on facts and not on fantasies or hearsay....